C. H. ROBINSON WORLDWIDE (CHRW)·Q4 2025 Earnings Summary
C.H. Robinson Surges 5% on Market Share Gains and $6 EPS Guidance for 2026
January 28, 2026 · by Fintool AI Agent
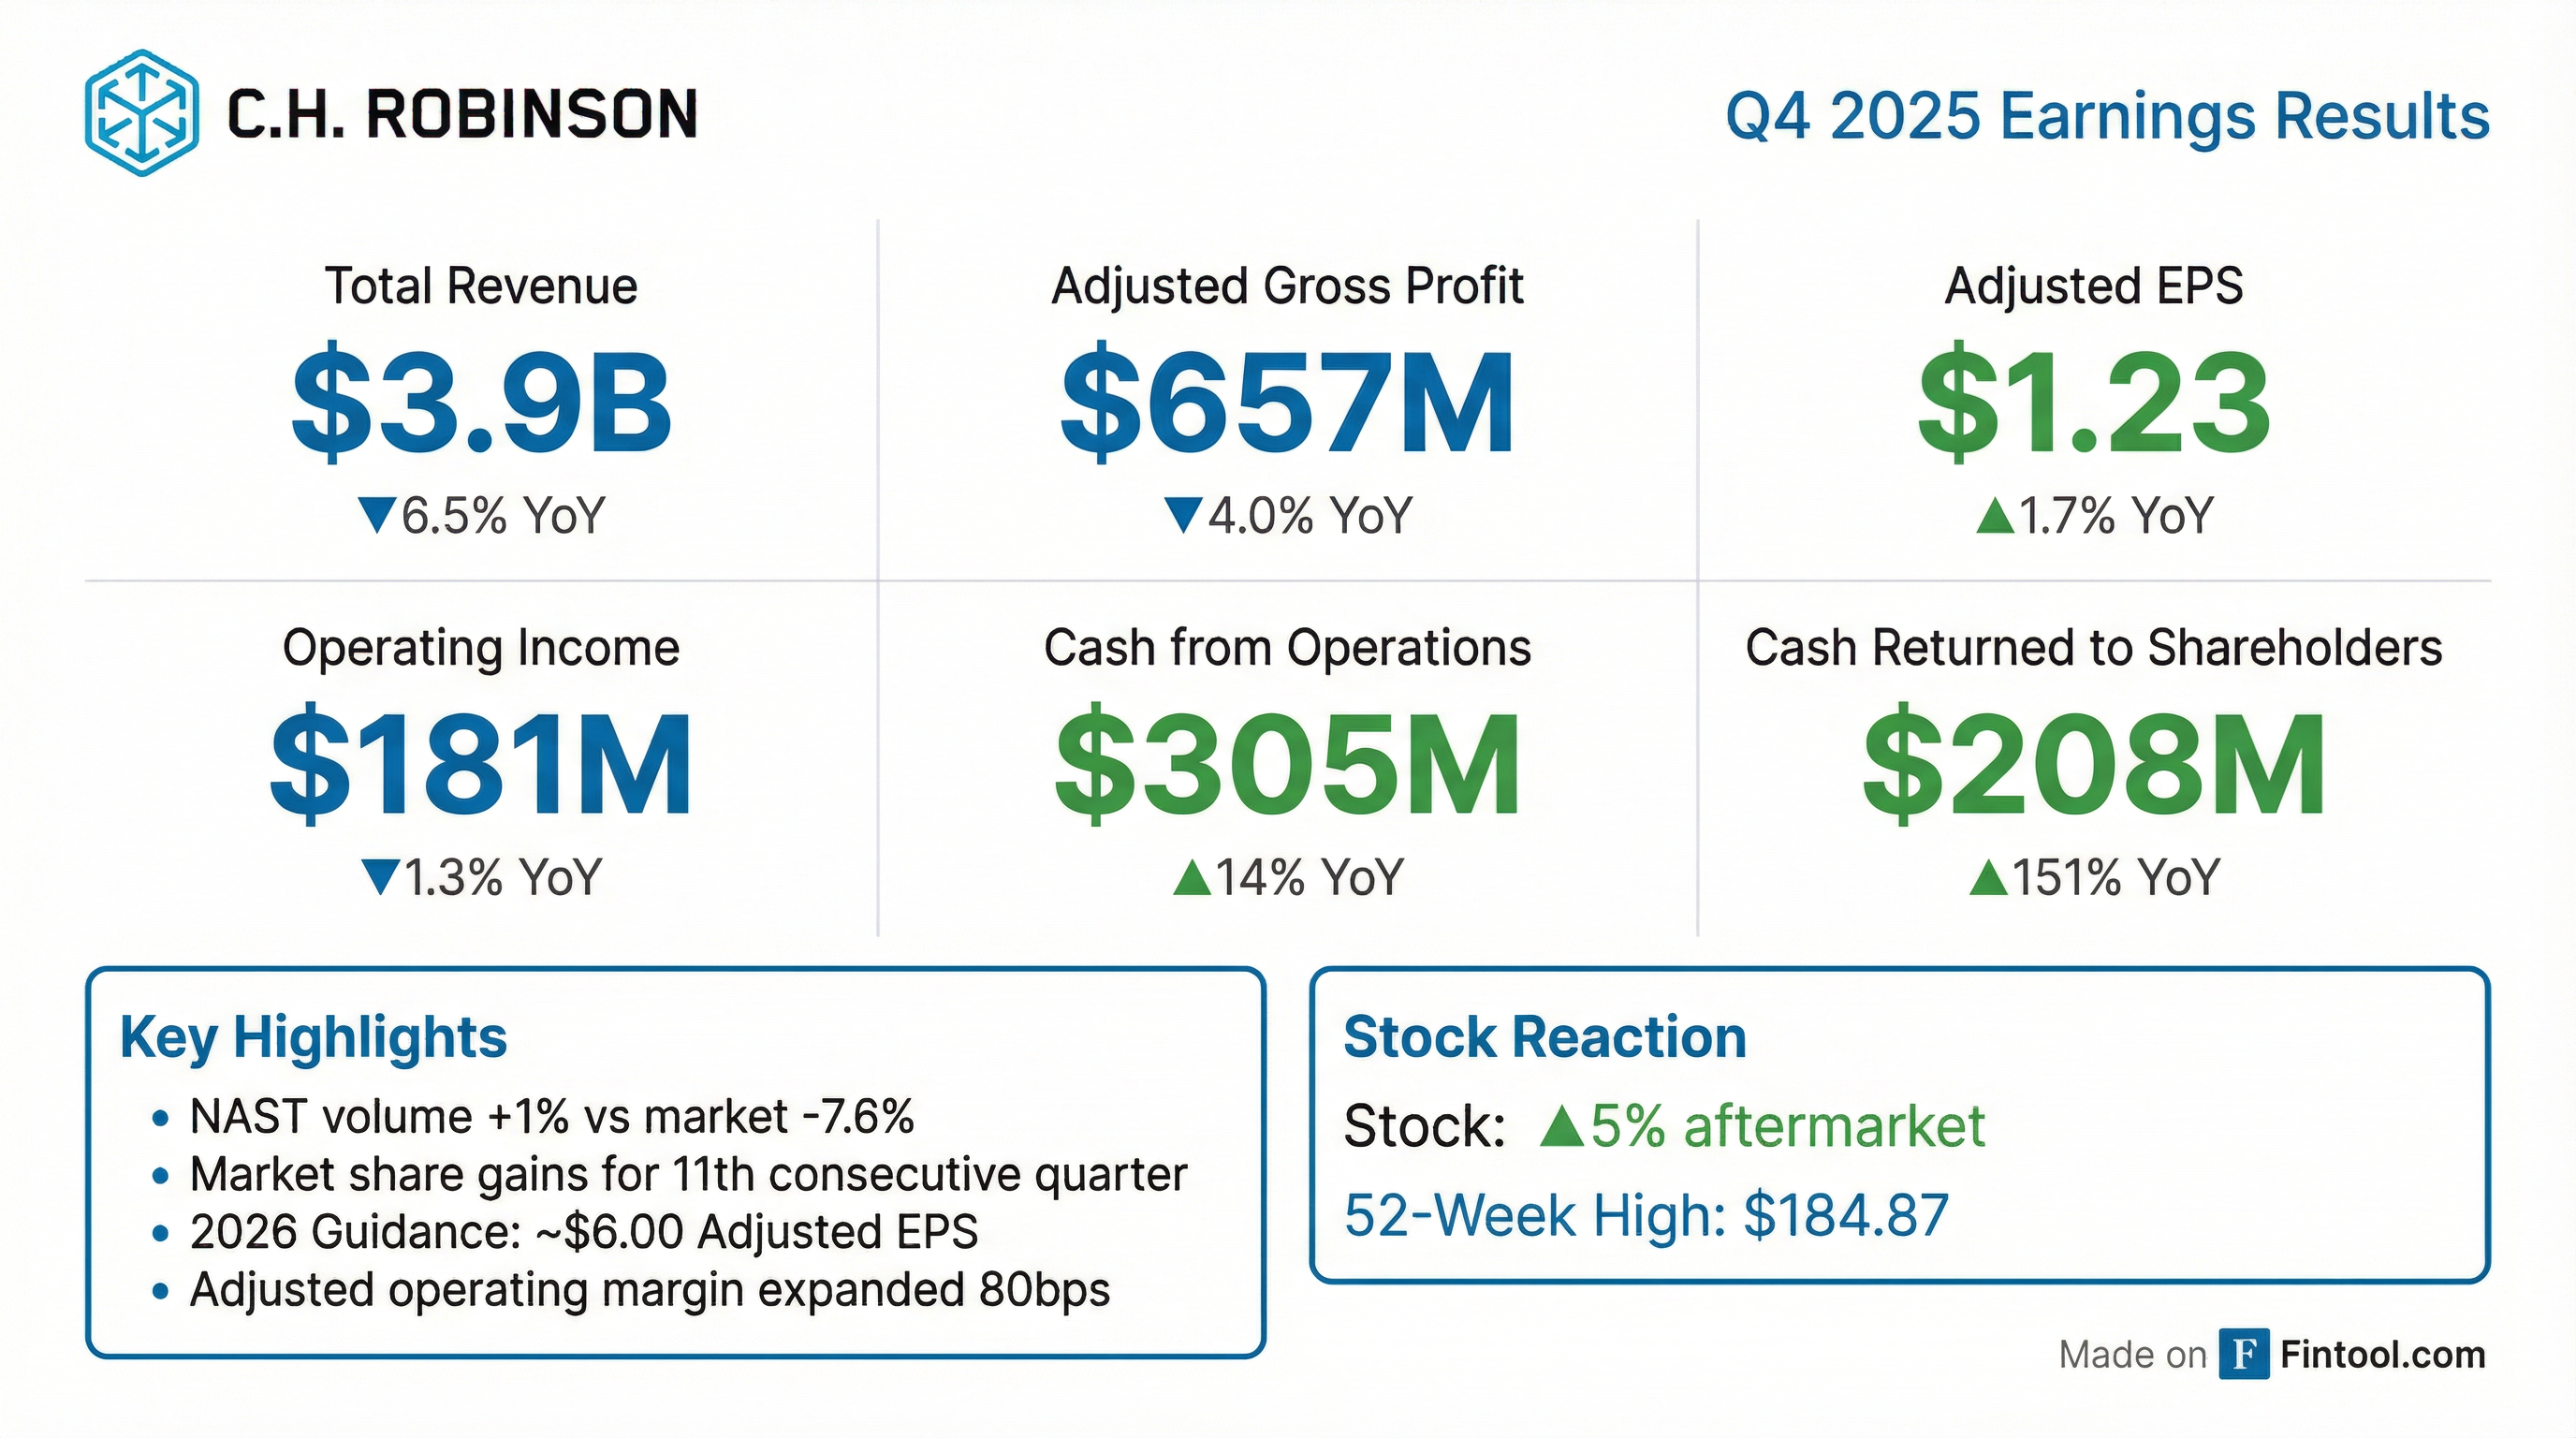
C.H. Robinson reported Q4 2025 adjusted EPS of $1.23, up 1.7% year-over-year despite total revenues declining 6.5% to $3.9 billion . The freight brokerage giant delivered its 11th consecutive quarter of market share gains in North American Surface Transportation (NAST), growing truckload volume 3% while the Cass Freight Shipment Index declined 7.6% . Shares surged 5% aftermarket to $193.74 after management guided to ~$6.00 adjusted EPS for 2026 .
Did C.H. Robinson Beat Earnings?
Yes — and decisively on profits despite revenue headwinds.
*Values retrieved from S&P Global
The revenue miss was largely expected given the challenging macro environment. CEO Dave Bozeman noted: "The Cass Freight Shipment Index declined year-over-year for the 13th consecutive quarter and was the lowest Q4 reading since the financial crisis of 2009" . What impressed investors was C.H. Robinson's ability to expand adjusted operating margin by 80 basis points to 27.6% despite these headwinds .
How Did the Stock React?
CHRW delivered one of its strongest earnings reactions in recent memory:
- Regular session: +2.3% to $184.28, hitting a 52-week high of $184.87
- Aftermarket: +5.1% to $193.74
- YTD performance: Stock has more than doubled from its 52-week low of $84.68
The combination of consistent execution, market share gains, and strong 2026 guidance drove the rally. Cash returned to shareholders of $207.7 million in Q4 — up 151% year-over-year — also signaled management confidence .
What Did Management Guide?
Management provided comprehensive 2026 targets:
Key assumptions include flat to 5% market volume growth and NAST adjusted gross profit per shipment flat to up 2% . Management noted Global Forwarding AGP per shipment is expected to reset to 2H 2023 levels (down ~10%) as ocean rates normalize .
2026 Expense Guidance:
- Personnel expenses: $1.25B-$1.35B (includes double-digit productivity gains weighted to 2H)
- SG&A expenses: $540M-$590M including D&A of $95-105M
- Tax rate: 18%-20% (Q1 expected below 15% due to stock compensation timing)
- Capex: $75-85M
Q1 2026 Note: Personnel expenses will increase sequentially due to FICA tax reset — estimated ~$15M impact in Q1 vs. Q4 .
What Changed From Last Quarter?
Several notable shifts from Q3 2025:
Positive Changes:
- NAST truckload volume accelerated to +3% (vs. +1.5% in Q3)
- Customs adjusted gross profit surged 30% YoY
- Share repurchases resumed: $133M in Q4 at average price of $147.63
Negative Changes:
- Ocean rates declined "substantially" vs. expectations laid out at December 2024 Investor Day
- Air tonnage declined 12.5%, worse than Q3's mid-single-digit decline
- Spot market costs spiked in last 5 weeks due to winter storms and driver regulations
How Did Each Segment Perform?
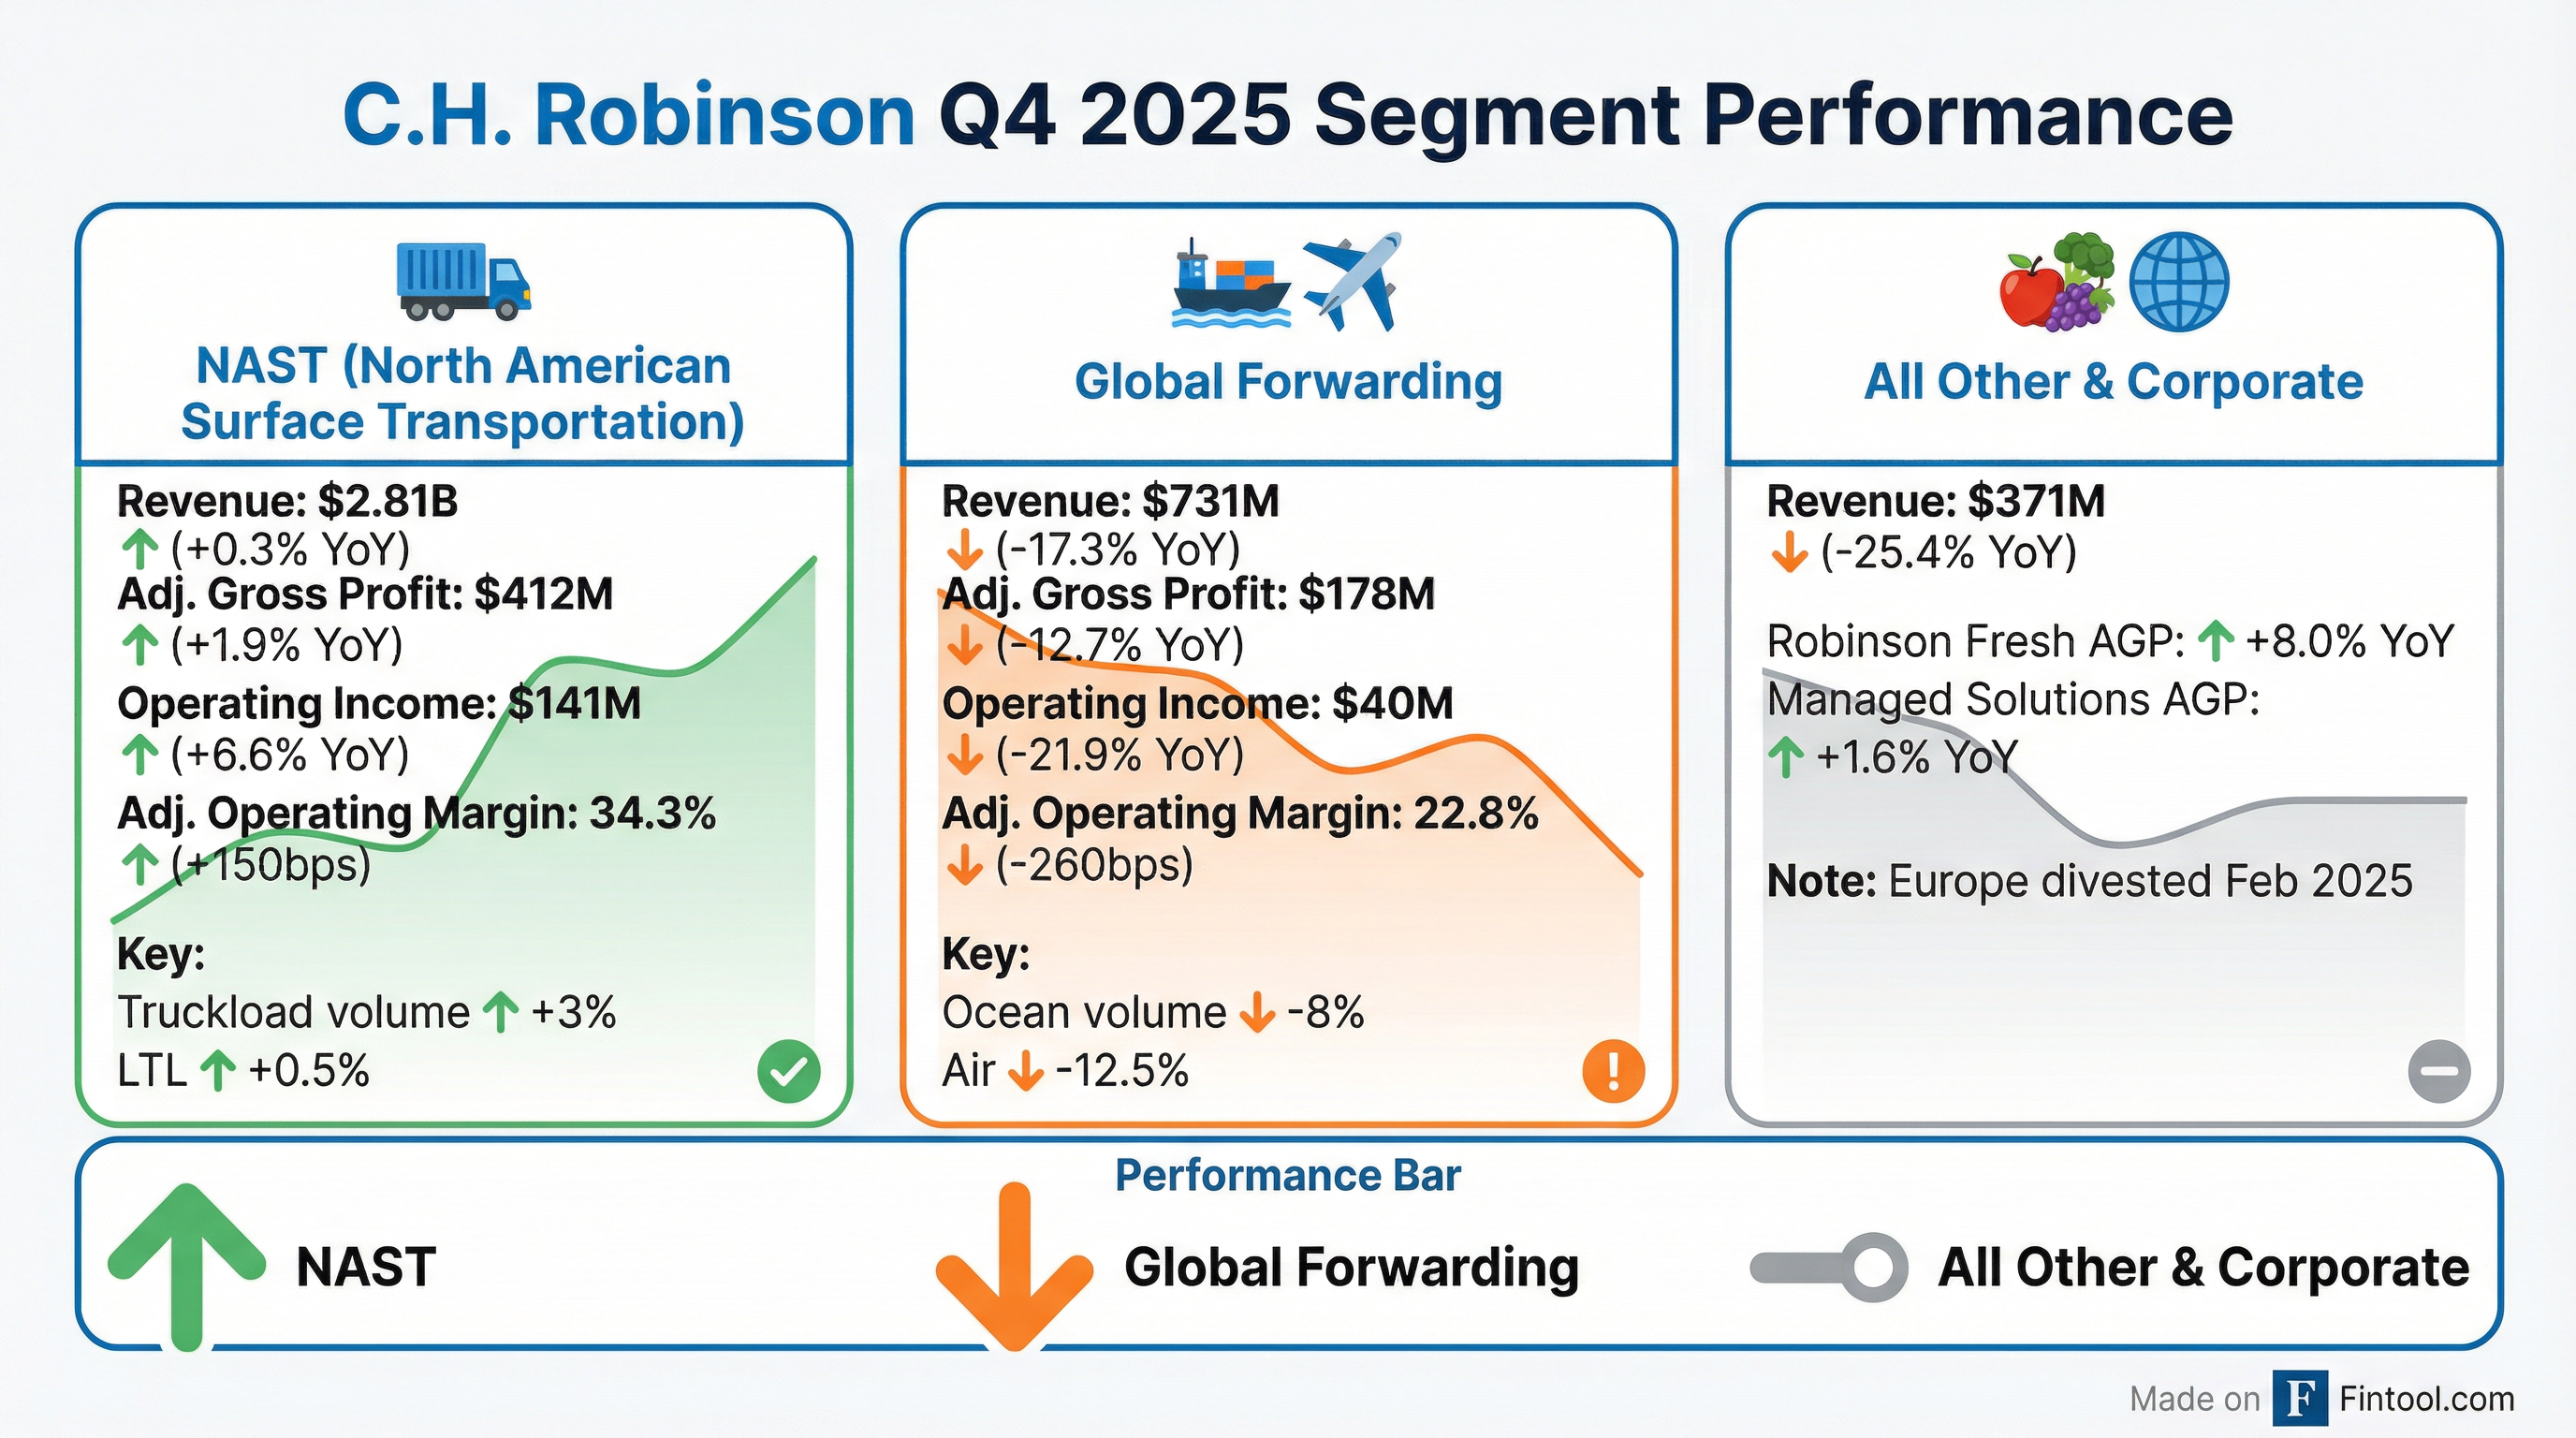
North American Surface Transportation (NAST) — The Outperformer
NAST delivered 11 consecutive quarters of market share outgrowth. Truckload volume increased 3% while the Cass Freight Shipment Index declined 7.6% . The 70/30 contractual/transactional volume mix provided stability .
Global Forwarding — Pressured by Ocean Rates
Ocean AGP decreased 22% driven by a 15% decline in AGP per shipment and 8% volume decline . Management attributed the weakness to "global trade policies, which caused previous front-loading, a dislocation of shipments and a more pronounced decline in demand after the third quarter peak season" .
Bright spot: Customs AGP surged 30% on strong transaction growth .
What's Driving the Transformation?
Management repeatedly emphasized "Lean AI" as the engine of margin expansion:
"We've consistently focused on controlling what we can control, which is providing differentiated service and solutions to our customers and carriers, executing with discipline, and continuously improving our business model and our cost to serve." — CEO Dave Bozeman
Productivity improvements:
- NAST: Double-digit productivity increase for full year 2025
- Global Forwarding: High-single-digit productivity increase
- Average headcount: Down 12.9% YoY to 12,085
The company has deployed a "fleet" of custom-built AI agents handling quoting, order entry, tracking, appointments, and carrier payments .
Key productivity milestone: 40%+ increase in shipments per person per day since end of 2022, measured across the entire NAST organization .
Q&A Highlights
Analysts focused on Q1 outlook, margin sustainability, and the transformation's durability:
On Q1 outlook and December pressure (Tom Wadewitz, UBS):
"December was heavily impacted by Global Forwarding and the ocean rate normalization... certainly the spot rate cost pressure that we saw in December did carry over to January." — CFO Damon Lee
Monthly AGP per business day vs. prior year: October -5%, November +6%, December -12% — with December's weakness driven primarily by ocean rate normalization .
On why margin squeeze will be shorter this cycle (Jonathan Chappell, Evercore):
"We're getting information into our people's hands quicker, more accurately, and more often... We believe we'll be able to manage that squeeze. We've said multiple times, we aren't going to be immune from it, but we have a high expectation that we will manage it quicker." — Michael Castagnetto
On headcount reductions vs. service quality (Reed Seay, Stephens):
"The process has fundamentally changed... If today we're doing 600,000 requests for freight quotes and it goes to 6 million, we don't have to add anyone back to the process." — CFO Damon Lee
On builder culture (Brandon Oglenski, Barclays):
"We have an in-house team of more than 450 engineers and data scientists that effectively and efficiently build fit-for-purpose AI agents... By being a builder culture, we don't rely on third-party software vendors to get our work done." — Arun Rajan, Chief Strategy and Innovation Officer
Concrete AI example — LTL missed pickup agent: Now tracking down missed pickups automatically, reducing return trips by 42% and saving over 350 hours of manual work daily. 95% of checks on missed LTL pickups are now automated .
Capital Allocation and Balance Sheet
The company has delivered more than 25 years of annually increasing dividends per share . Capital expenditures for 2026 are expected to be $75-85 million .
Balance Sheet Strength:
- Liquidity: $1.49B (including $1.33B credit facilities + $161M cash)
- Net debt/EBITDA: 1.03x (down from 1.17x at Q3 end)
CFO Damon Lee emphasized: "This financial strength is a key differentiator in our industry, giving us the ability to continue investing through the bottom of the freight cycle" .
Full Year 2025 Performance
The 490 basis point expansion in adjusted operating margin demonstrates the success of the transformation strategy, even as revenues declined.
What Should Investors Watch?
Near-term catalysts:
- Q1 2026 earnings (late April) — first look at 2026 execution
- Ocean rate trajectory — key to Global Forwarding recovery
- Truckload cycle inflection — management noted spot rates rose in late Q4
Key risks:
- Prolonged freight recession (Cass Index at 13-quarter low)
- Trade policy disruptions impacting global forwarding
- Execution risk on aggressive margin targets
2026 guidance bridge : The path to ~$6.00 EPS assumes market share gains continue, AGP yields optimize, and productivity improvements deliver operating leverage. Management retained "optionality to deliver demonstrable outgrowth" beyond the 40%/30% margin targets.
The Bottom Line
C.H. Robinson delivered another quarter of disciplined execution, growing market share while expanding margins in a difficult freight environment. The 2026 guidance of ~$6.00 adjusted EPS — an 18% increase over 2025 — combined with resumed share repurchases sent the stock to a 52-week high. With NAST operating margins approaching the 40% target and Lean AI productivity improvements accelerating, management's multi-year transformation is delivering tangible results.
CEO Dave Bozeman closed the call with confidence: "You've heard us say that we expect the next two years to be more exciting than the last two years, and the last two years have been pretty damn exciting" .
Related Links: